Students can Download 2nd PUC Statistics Previous Year Question Paper June 2017, Karnataka 2nd PUC Statistics Model Question Papers with Answers helps you to revise the complete Karnataka State Board Syllabus and score more marks in your examinations.
Karnataka 2nd PUC Statistics Previous Year Question Paper June 2017
Time: 3 Hrs 15 Min
Max. Marks: 100
Instructions:
- Statistical table and graph sheets will be supplied on request.
- Scientific calculators may be used.
- All working steps should be clearly shown.
Section – A
I. Answer any TEN of the following questions: ( 10 x 1 = 10 )
Question 1.
Define fecundity.
Answer:
The capacity of a women bear children.
Question 2.
Mention one characteristic of index numbers.
Answer:
Index numbers are specialised averages.
Question 3.
Theoretically which average is considered as the best average in the construction . of index number?
Answer:
Geometric mean.
Question 4.
What is a Historigram?
Answer:
The graph of time series is called Historigram.
![]()
Question 5.
If p = 0.2 for Bernoulli distribution, find variance.
Answer:
Variance = pq = 0.2 x 0.8 = 0.16 Here q = 1 – P.
Question 6.
If Z is a SNV and P(Z > k) = 0.05, find the value of k.
Answer:
From the table k= 1.64.
Question 7.
What is an estimator? ;
Answer:
The statistic used to estimate the population parameter is an estimator.
Question 8.
What is test statistics?
Answer:
Test statistic is the statistic whose distribution test being conducted.
Question 9.
When the pooling done in testing of goodness of fit?
Answer:
When expected frequencies are below 5(Ei < 5) =
Question 10.
In S.Q. C what is defect?
Answer:
An Defect is quality characteristic which does not conform to specifications.
Question 11.
The graphical solution to the L.P.P lies in the first quadrant. Give reason.
Answer:
Because of non-negative restrictions both x and y are positive on x, y – plane.
![]()
Question 12.
Mention a property of a competitive game.
Answer:
Number of competitors should be finite.
Section – B
II. Answer any ten of the following questions:
Question 13.
In a life table, if l0= 1,00,000 and T0 = 65,00,000 years then, find longevity.
Answer:

Question 14.
State two norms (considerations) for the selection of base year.
Answer:
- Bse year should be economically stable
- Base year should not be too distant from the current year.
Question 15.
If Σp0q1 = 1125 and Σp0q0 = 1250 then, find suitable quantity index number.
Answer:
Quantity index number: Q01

Question 16.
What is seasonal variation? Give an example.
answer:
Seasonal variations refers to the variations caused annually by the seasons of the year, which are regular, periodic and short term variations in the time series.
There is more sales of ice creams and cool drinks in summer season.
![]()
Question 17.
Write down the two assumptions of interpolation and extrapolation.
Answer:
- There are no sudden jumps in the values of dependent variable (y) from one period to
- There will be no. consecutive missing value int he series.
Question 18.
Write down the range and mean of a hypergeometric distribution whose parameters are a = 4, b = 6 and n = 5.
Answer:
Range: x = 0, 1, 2, min (a, n)
= 0, 1, 2, …………..min (4, 5) = 0,1,2, 3, 4
![]()
Question 19.
For a Chi-square (χ2) variate, with 10 d.f. p{0 < χ2 < 9.34) = 0.5. Find median and mode.
Answer:
Median = 9.34 and mode = (n – 2) = 10 – 2 = 8.
Question 20.
Define size of the test and power of a test.
Answer:
Probability of occurrence of type error or the probability of rejecting HO, when it is fr called size of the test, also called as level of significance.
Probability of rejecting Ho when it is not true.
![]()
Question 21.
Write two applications of χ2 test. ;
Answer:
- To test whether the population has given variance.
- To test whether the two attributes are independent.
Question 22.
Mention two advantages of acceptance sampling.
Answer:
- It is used when the items are of destructive in nature.
- It is less expensive, as 100% inspections more expensive.
Question 23.
Which of the two feasible solutions (12, 10) and (14, 5) of an E.P.P minimises the objective function Z = 5X + 4Y.
Answer:
Here Z (12, 10) = 5(12) + 4(10)= 100 and
Z (14, 5) = 5(14) + 4(5) = 90. (14,5) minimises the objective function.
Question 24.
From the following pay-off matrix, obtain the value of game.

Answer:

Row minimum circled and column boxed. Value of the of the game: V = 5
![]()
Section – C
III. Answer ANY EIGHT of the following questions: ( 8 x 5 = 40 )
Question 25.
Compute the gross reproduction rate from the following data:

Answer:
G.R.R = (i) \(\sum_{i=15}^{49}\) W.S.F.R where i = 5 Age width and W.S.F.R-women specific fertilise rate.

Similarly remaining W.S.F Rs. can be computed

GRR = 5(260) = 1300 female birth per 100 women of (15 – 49) in a year.
Question 26.
Calculate Kelly’s price Index number from the following data and comment on the result.

Answer:

Question 27.
Compute the cost of living index number for the following data:

Answer:

Question 28.
For the following data draw a trend line by the method of semi averages.

(OR)
Answer:
Let x and y be the year and sales

Explain semi – averges method of measuring trend.
(For visually challenged students only)
Semi-averages method: In this method the original data is divided into two equal parts and averages are calculated for both the parts. These averages are called semi-averages. Teh two semi-averages are written against the centres of the two time points.
After drawing the actual line, the two trend values are plotted and joined by a straight line, extended on either side is called trend line.
![]()
Question 29.
For the following data interpolate the value of Y, when X = 30.

Answer:
Number of known values of ‘y’ n 4, then prepare the leading differences upto Δ3
y = ?, x = 30

![]()
Question 30.
In a college 35% students are girls. Find the probability that:
(i) two are girls,
(ii) at least one is a girl in a random sample of 5 students.
Answer:
Let x be the number of girls is a binomial variate with the parameters n-5,p = 0.35 and
p = 1 -P
= 1 – 0.35 = 0.65.
Then the p is:
p(x) = ncx px qn – x; x = 0,1,2, …… n
= 5cx (0.35)x (0.65)5-x; x = 0,1,2, …….. 5
(i) p( girls ) =p(x = 2) = = 5c2 (0.35)2 (0.65)5 – 2 = 10 x 0.1225 x 0.2746 = 0.3364
(ii) p(at least one is a girl) = p(x > 1) = 1 – p (x < 1) = 1 – p (x = 0)
= 1 -5C0 (0.35)0 (0.65)5 – 0= 1 – [1 x 1 x 0.1160] = 0.884
Question 31.
State five properties of a normal distribution
(i) The curve is bell-shaped and X̄ = M = z
(ii) The curve is symmetric i.e, Non-skew ((β1 = 0)
(iii) The curve is meso kurtic (β2 = 3)
(iv) Area under the curve is ‘1’.
(v) For the distribution : Mean = m, variance = 62 and S . D = σ.
Question 32.
“In an election the leaders of a party contend that they would secure more than 36% of votes. A pre-poll survey of 400 voters revealed that the percentage is 42. Does the survey support the leader’s claim? (Use 5% L.O.S)
Answer:
Given: p0 = 0.36, n = 400, p = 0.42, a = 5%
H0 : Party secures 36% vate (i.e., p0 = 0.36)
H1 : Party secures more than 36% vote (i.e., p0 > 0.36)
{upper tail test + k}
Under H0 , the test statistic is :

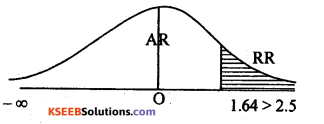
At a = 5% the upper tail critical value +k = 1.64 .
Here Zcal lies in rejection region (R. R) i.e., Zcal > k. H0 is rejected and H1 is accepted. Conclusion: Party secures more than 36% votes (p0 > 0.36)
Question 33.
The following is the data regarding family condition and examination result of 100 students. Test whether results depends on family conditions.
(Use α = 0.01)

Answer:
H0 : Family condition and Examination result are independent.
H1 : Family condition and Examination result are dependent {upper tail test}
The 2 x 2 contingency table is:

The χ2 test statistic is :

At a = 1% he upper tail critical value for I d.f is k2 = 6.65

Here χ2cal lies in acceptance region. H0 is accepted
Conclusion: Family condition and examination result are independent.
Question 34.
Find control limits for R-chart with sample size 4.

Answer:
For R – chart, standard not known, we need
R̄ = \(\frac{\Sigma \mathrm{R}}{k}=\frac{30}{6}\) = 5; k=6 sampleno. and n = 4
The control limits are: C.L = R̄ = 5
L.C.L = D3 R̄ = 0 x 5=0
U.C.L=D4 R̄ =2.282 x 5=11.41
![]()
Question 35.
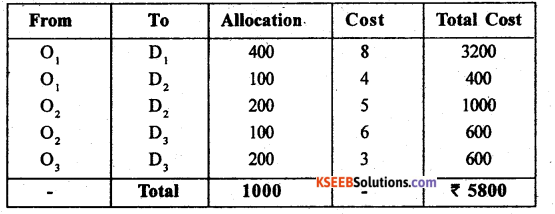
Find the initial basic feasible solution to the following transportation problem by NWCR method and find transportation cost to this solution.

Answer:
By N.W.C.R first allocation is made in the cell (1,1) as: Xu = Min(a, b) = m, n (500,400) = 40, and replace 500 by (500-400)= 100
Next allocation is made at (1,2)
Question 36.
Purchase cost of an item is Rs. 5,000. Its running costs and resale values in different years are as follows:

Find the optimum period of replacement of item.
Answer:
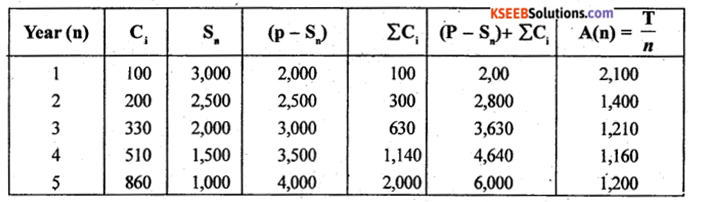
From the above-the annual average cost is minimum ,for the 4th year and so, n = 4 is the optimal replacement period. A(4) = ₹ 1.160.
From the normal equaitons: na + Σx = Σy

The fitted straight lien trend equation is:
y = a + bx; ŷ = 51 + 1.5x
Estimation of production for 2008;x = 5
ŷ(2008) = 51 + 1.5 (5) = 58.5 (000’sTons)
Trend values: ŷ (2000) = 51 + 1.5(-3) = 46.5
ŷ(2001) = 51 + 1.5(-2) = 48
Similarlly remaining trend values can be computed.
Section – D
IV. Answer any two of the following questions: ( 2 x 10 = 20 )
Question 37.
By taking locality ‘B* as standard calculate the STDR’s for both localities. Mention which locality is more healthier?

Answer:
Since locality B is take as standard, so calculating C.D.R is same as calculation S.D.R

Conclusion: Here S.D.R (B) L.S.D.R(A)
Locality B is healthier.
Question 38.
Compute Laspcyre’s, Paasche’s and Fisher’s price index numbers for the following data:

Answer:

![]()
Question 39.
For the following data fit a straight line trend by least square method, obtain trend values. Estimate the production for the year 2008.

Answer:

and all other allocations are made in the same way until the last allocation at (3,3) as below:

The suggested Initial basic feasible solution and the total transportation cost is:
Question 40.
For the following data fit a Poisson distribution and test for goodness of fit at 5% level of significance.
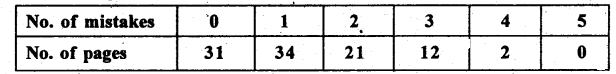
Answer:
Let x be the no. of mistakes is a poisson variate the parameter is obtained as below:
Let f be the no. of pages.

Theoretical frequency: Tx = p{x) N
T0 =p(x = 0)100 = \(\frac{e^{-i .2} 1.2^{0}}{0 !}\) x 100 = 0.3012 x 100 = 30.12

T5 and more = N – [T0 + T1 + T2 + T3 + T4 = 100 – [30 + 36 + 22 + 9 + 3] = 100 – 100 = 0
The fitted observed and theoretical frequency distribution is:

chi – Square test: H0 : Poisson distribution is a good fit [Oi = Ei]
Hj: poisson distribution is not good fit [Oi = Ei] {Upper tail test}
Under H0, the χ2 – test stastic is:
λ is estimated from the parameter and so degrees of freedom is (n – 2)

Ay α = 5% for (n – 2) = 4.2 = 2 d.f the upper tail critical value k2= 5.99

Here χ2calllies in acceptance region (A.R)
.’. Ho is accepted.
Conclusion: Poisson distribution is good fit.
Section – E
V. Answer any two of the following questions: ( 2 x 5 = 10)
Question 41.
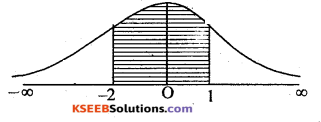
Marks scored by the students of a class follow normal distribution with mean 80 and S.D.5. Find the probability that a student selected at random from the class scored:
(i) More than 90 marks
(ii) Between 70 and 85 marks.
Answer:
Marks scored by the students is a normal variable with the parameters. µ = 80, σ = 5.
Then S.N.V:


(i) p(marks more than 90) =p(x > 90) = p(z) > \(\frac{90-80}{5}\)
p(z > 2) = Area from 2 to ∞
from the table = 0.0228
(ii) p(marks between 70 and 85) =p(70 <x< 85)
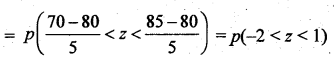
= Area tray (-2) to 1
= Area tray (-2) to ∞ – Area tray 1 to h
= 0.9772 – 0.1587 = 0.8185.
Question 42.
A company manufactures car tyres. Their average life is 40,000 km and standard deviations 5,000 km. A change in the production process is believed to result in a better product. A test sample of 100 new tyres has mean life of 41,000 km. Can you conclude at 1% L.O.S. that the new product gives better result?
Answer:
Given: µ = 40,000, σ = 5,000, n = 100, x̄ =41,000, α = 1% .
H0 : Mean lif eof tyres is 40,000 kms (i.e., µ = 40,000)
H1 : Mean life of tyres is mroe than 40,000 kms (better result) (i.e., µ > 40,000) {upper tail test)

Under H0the test statistics is:

At α = 1% the lower tail critical value k = 2.33
Here zcal lies in acceptance region (A.R) H0 is accepted
∴ Ho is accepted.
Conclusion: Mean life of tyres is 40,000kms.
![]()
Question 43.
I. Q of 5 students before and after training is given below:

H0 : before and after training is source (µ1 = µ2)
H1 has increased after training /training is effective (µ1 < µ2

At α = 0.05/5% the lower tail critical value k = -2.13
Here tcal lies in acceptance region (A.R)
∴ Ho is accepted.
Conclusion: I.Q before and after training is same.
Question 44.
There is a demand for 3600 units/year. The cost of placing an order is Rs. 50. Maintenance cost Rs. 9/unit/year and shortage cost is Rs. 3/unit/year.
Find:
(i) EOQ
(ii) Minimum average cost per year.
Answer:
Given : R = 3600 units/year, C3 = ₹ 50, C1 = ₹ 9/unit/year C2 = ₹ 3/unit/year
Use EOQ model II
